
 - Blog
| Conference: | WCC |
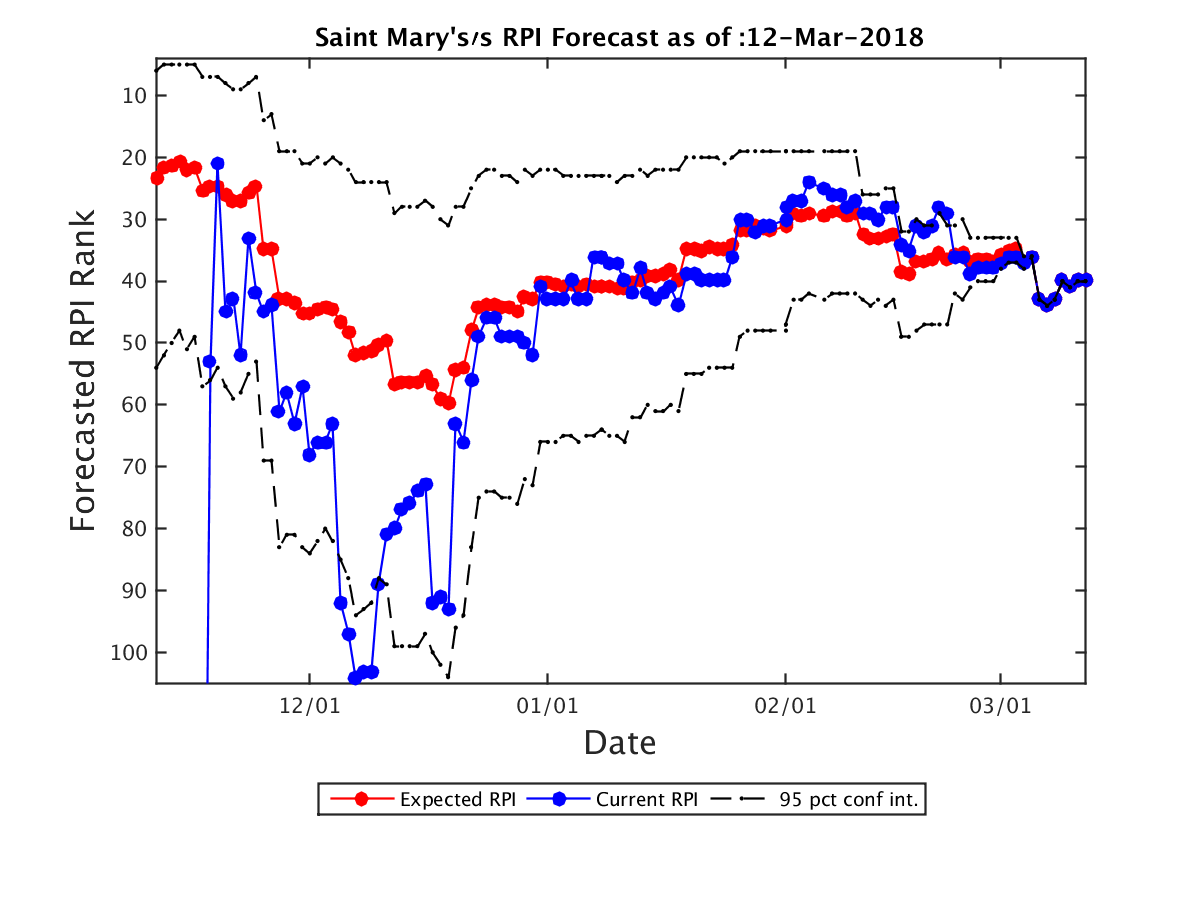
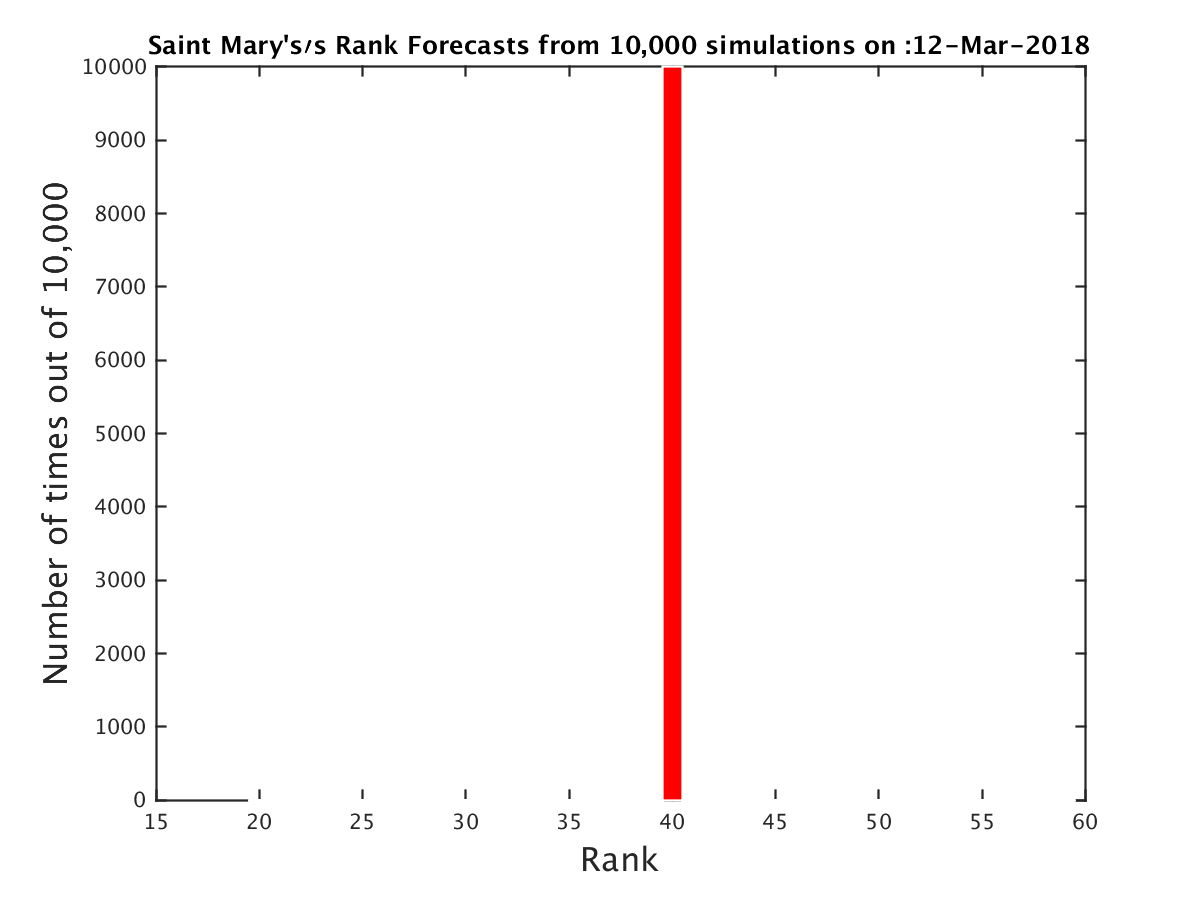
| Expected RPI: | 40.0 |
| Current RPI: | 40 |
| Expected SOS: | 169 |
| Current SOS: | 169 |
| Current Record: | 28-5 |
| Expected Record: | 28-5 |
| Current Conf Record: | 17-3 |
| Expected Conf Record: | 17-3 |
| Expected Record vs RPI 1-25: | 1-1 |
| Expected Record vs RPI 26-50: | 1-0 |
| Expected Record vs RPI 51-100: | 2-2 |
| Expected Record vs RPI 101-200: | 12-2 |
| Expected Record vs RPI 200+: | 12-0 |
| Current OOC Record: | 11-2 |
| Expected OOC Record: | 11-2 |
| Expected OOC RPI: | 44 |
| Expected OOC SOS: | 182 |
| Final Record | Expected RPI | Probability |
|---|---|---|
| 28-5 | 40.0 | 100.00% |
| Date | Opponent (Expected RPI) | Conf | Location | Score | Outcome | Prob(W) | Spread |
|---|---|---|---|---|---|---|---|
| 11-11 | St. Francis PA (178.0) | NEC | H | 85-68 | W | 100% | 0.0 |
| 11-13 | New Mexico St. (35.0) | WAC | H | 92-74 | W | 100% | 0.0 |
| 11-15 | Cal St. Fullerton (131.0) | BW | H | 76-57 | W | 100% | 0.0 |
| 11-19 | San Jose St. (314.0) | MWC | A | 61-79 | W | 100% | 0.0 |
| 11-23 | Harvard (117.0) | Ivy | N | 71-89 | W | 100% | 0.0 |
| 11-24 | Washington St. (179.0) | P12 | N | 84-79 | L | 0% | 0.0 |
| 11-26 | Georgia (79.0) | SEC | N | 83-81 | L | 0% | 0.0 |
| 12-2 | California (216.0) | P12 | A | 63-74 | W | 100% | 0.0 |
| 12-4 | Sacramento St. (309.0) | BSky | H | 70-54 | W | 100% | 0.0 |
| 12-9 | Seattle (165.0) | WAC | H | 97-73 | W | 100% | 0.0 |
| 12-16 | UC Irvine (119.0) | BW | H | 73-66 | W | 100% | 0.0 |
| 12-19 | Dayton (146.0) | A10 | H | 69-54 | W | 100% | 0.0 |
| 12-22 | UNC Asheville (130.0) | BSth | H | 95-69 | W | 100% | 0.0 |
| 12-28 | Loyola Marymount (258.0) | WCC | H | 87-59 | W | 100% | 0.0 |
| 12-30 | BYU (67.0) | WCC | A | 64-74 | W | 100% | 0.0 |
| 1-4 | Pacific (190.0) | WCC | H | 74-56 | W | 100% | 0.0 |
| 1-6 | San Diego (143.0) | WCC | H | 70-63 | W | 100% | 0.0 |
| 1-11 | Santa Clara (264.0) | WCC | A | 57-81 | W | 100% | 0.0 |
| 1-13 | Pepperdine (317.0) | WCC | A | 67-91 | W | 100% | 0.0 |
| 1-18 | Gonzaga (21.0) | WCC | A | 71-74 | W | 100% | 0.0 |
| 1-20 | Pacific (190.0) | WCC | A | 69-72 | W | 100% | 0.0 |
| 1-25 | BYU (67.0) | WCC | H | 75-62 | W | 100% | 0.0 |
| 1-27 | Portland (285.0) | WCC | H | 72-55 | W | 100% | 0.0 |
| 2-1 | San Francisco (139.0) | WCC | H | 79-43 | W | 100% | 0.0 |
| 2-3 | San Diego (143.0) | WCC | A | 62-65 | W | 100% | 0.0 |
| 2-8 | Loyola Marymount (258.0) | WCC | A | 62-83 | W | 100% | 0.0 |
| 2-10 | Gonzaga (21.0) | WCC | H | 65-78 | L | 0% | 0.0 |
| 2-15 | San Francisco (139.0) | WCC | A | 70-63 | L | 0% | 0.0 |
| 2-17 | Portland (285.0) | WCC | A | 61-73 | W | 100% | 0.0 |
| 2-22 | Pepperdine (317.0) | WCC | H | 75-61 | W | 100% | 0.0 |
| 2-24 | Santa Clara (264.0) | WCC | H | 67-40 | W | 100% | 0.0 |
| 3-3 | Pepperdine (317.0) | WCC | N | 69-66 | W | 100% | 0.0 |
| 3-5 | BYU (67.0) | WCC | N | 72-85 | L | 0% | 0.0 |
| Team | Conf | Curr Wgt | Fut Wgt | Curr W/L | Exp W/L | Curr Impact | Exp Impact |
|---|---|---|---|---|---|---|---|
| Saint Mary's | WCC | 26.44 | 26.44 | 83.66 | 83.66 | 17.80 | 17.80 |
| BYU | WCC | 5.48 | 5.48 | 74.19 | 74.19 | 2.65 | 2.65 |
| Pepperdine | WCC | 5.42 | 5.42 | 17.86 | 17.86 | -3.49 | -3.49 |
| Gonzaga | WCC | 4.08 | 4.08 | 90.62 | 90.62 | 3.31 | 3.31 |
| San Francisco | WCC | 4.05 | 4.05 | 53.33 | 53.33 | 0.27 | 0.27 |
| Portland | WCC | 4.05 | 4.05 | 25.93 | 25.93 | -1.95 | -1.95 |
| Loyola Marymount | WCC | 4.03 | 4.03 | 35.71 | 35.71 | -1.15 | -1.15 |
| San Diego | WCC | 4.02 | 4.02 | 60.71 | 60.71 | 0.86 | 0.86 |
| Santa Clara | WCC | 4.00 | 4.00 | 37.04 | 37.04 | -1.04 | -1.04 |
| Pacific | WCC | 3.95 | 3.95 | 44.83 | 44.83 | -0.41 | -0.41 |
| Cal St. Fullerton | BW | 1.78 | 1.78 | 64.29 | 64.29 | 0.51 | 0.51 |
| Seattle | WAC | 1.69 | 1.69 | 58.62 | 58.62 | 0.29 | 0.29 |
| San Jose St. | MWC | 1.67 | 1.67 | 10.71 | 10.71 | -1.31 | -1.31 |
| New Mexico St. | WAC | 1.66 | 1.66 | 86.21 | 86.21 | 1.21 | 1.21 |
| Sacramento St. | BSky | 1.64 | 1.64 | 17.24 | 17.24 | -1.08 | -1.08 |
| UC Irvine | BW | 1.62 | 1.62 | 50.00 | 50.00 | 0.00 | 0.00 |
| California | P12 | 1.62 | 1.62 | 26.67 | 26.67 | -0.75 | -0.75 |
| Washington St. | P12 | 1.59 | 1.59 | 36.67 | 36.67 | -0.42 | -0.42 |
| St. Francis PA | NEC | 1.56 | 1.56 | 59.26 | 59.26 | 0.29 | 0.29 |
| Georgia | SEC | 1.54 | 1.54 | 53.12 | 53.12 | 0.10 | 0.10 |
| Harvard | Ivy | 1.54 | 1.54 | 58.62 | 58.62 | 0.27 | 0.27 |
| Dayton | A10 | 1.52 | 1.52 | 46.67 | 46.67 | -0.10 | -0.10 |
| UNC Asheville | BSth | 1.52 | 1.52 | 63.33 | 63.33 | 0.40 | 0.40 |
| UC Riverside | BW | 0.32 | 0.32 | 24.14 | 24.14 | -0.17 | -0.17 |
| UC Davis | BW | 0.32 | 0.32 | 66.67 | 66.67 | 0.11 | 0.11 |
| UC Santa Barbara | BW | 0.32 | 0.32 | 70.00 | 70.00 | 0.13 | 0.13 |
| Portland St. | BSky | 0.26 | 0.26 | 56.67 | 56.67 | 0.03 | 0.03 |
| Cal Poly | BW | 0.25 | 0.25 | 24.14 | 24.14 | -0.13 | -0.13 |
| Long Beach St. | BW | 0.24 | 0.24 | 41.94 | 41.94 | -0.04 | -0.04 |
| San Diego St. | MWC | 0.24 | 0.24 | 67.74 | 67.74 | 0.09 | 0.09 |
| Nevada | MWC | 0.22 | 0.22 | 79.41 | 79.41 | 0.13 | 0.13 |
| Utah Valley | WAC | 0.22 | 0.22 | 65.52 | 65.52 | 0.07 | 0.07 |
| Stanford | P12 | 0.22 | 0.22 | 54.55 | 54.55 | 0.02 | 0.02 |
| Washington | P12 | 0.22 | 0.22 | 62.50 | 62.50 | 0.05 | 0.05 |
| Cal St. Northridge | BW | 0.20 | 0.20 | 14.29 | 14.29 | -0.14 | -0.14 |
| Idaho St. | BSky | 0.19 | 0.19 | 42.86 | 42.86 | -0.03 | -0.03 |
| Arizona St. | P12 | 0.19 | 0.19 | 64.52 | 64.52 | 0.06 | 0.06 |
| Weber St. | BSky | 0.19 | 0.19 | 60.71 | 60.71 | 0.04 | 0.04 |
| Utah St. | MWC | 0.19 | 0.19 | 48.48 | 48.48 | -0.01 | -0.01 |
| USC | P12 | 0.18 | 0.18 | 67.65 | 67.65 | 0.06 | 0.06 |
| Grand Canyon | WAC | 0.18 | 0.18 | 65.62 | 65.62 | 0.06 | 0.06 |
| Massachusetts | A10 | 0.16 | 0.16 | 39.39 | 39.39 | -0.03 | -0.03 |
| Boise St. | MWC | 0.15 | 0.15 | 73.33 | 73.33 | 0.07 | 0.07 |
| Northern Arizona | BSky | 0.15 | 0.15 | 13.33 | 13.33 | -0.11 | -0.11 |
| Idaho | BSky | 0.15 | 0.15 | 68.97 | 68.97 | 0.06 | 0.06 |
| UT Rio Grande Valley | WAC | 0.15 | 0.15 | 43.33 | 43.33 | -0.02 | -0.02 |
| Utah | P12 | 0.14 | 0.14 | 63.33 | 63.33 | 0.04 | 0.04 |
| Texas Southern | SWAC | 0.14 | 0.14 | 44.12 | 44.12 | -0.02 | -0.02 |
| Wyoming | MWC | 0.13 | 0.13 | 59.38 | 59.38 | 0.02 | 0.02 |
| Chicago St. | WAC | 0.13 | 0.13 | 3.33 | 3.33 | -0.12 | -0.12 |
| Southern Utah | BSky | 0.12 | 0.12 | 36.67 | 36.67 | -0.03 | -0.03 |
| Colorado | P12 | 0.12 | 0.12 | 53.12 | 53.12 | 0.01 | 0.01 |
| Oregon St. | P12 | 0.12 | 0.12 | 50.00 | 50.00 | 0.00 | 0.00 |
| Eastern Washington | BSky | 0.12 | 0.12 | 56.25 | 56.25 | 0.02 | 0.02 |
| Hawaii | BW | 0.12 | 0.12 | 53.57 | 53.57 | 0.01 | 0.01 |
| Princeton | Ivy | 0.12 | 0.12 | 42.86 | 42.86 | -0.02 | -0.02 |
| UT Arlington | SB | 0.12 | 0.12 | 60.61 | 60.61 | 0.02 | 0.02 |
| Robert Morris | NEC | 0.10 | 0.10 | 48.48 | 48.48 | -0.00 | -0.00 |
| Colorado St. | MWC | 0.10 | 0.10 | 32.26 | 32.26 | -0.04 | -0.04 |
| New Mexico | MWC | 0.10 | 0.10 | 54.55 | 54.55 | 0.01 | 0.01 |
| Air Force | MWC | 0.10 | 0.10 | 34.48 | 34.48 | -0.03 | -0.03 |
| Arkansas Pine Bluff | SWAC | 0.10 | 0.10 | 40.00 | 40.00 | -0.02 | -0.02 |
| UNLV | MWC | 0.10 | 0.10 | 60.61 | 60.61 | 0.02 | 0.02 |
| Cal St. Bakersfield | WAC | 0.10 | 0.10 | 33.33 | 33.33 | -0.03 | -0.03 |
| UMKC | WAC | 0.10 | 0.10 | 27.59 | 27.59 | -0.05 | -0.05 |
| Penn | Ivy | 0.10 | 0.10 | 74.19 | 74.19 | 0.05 | 0.05 |
| Saint Joseph's | A10 | 0.10 | 0.10 | 50.00 | 50.00 | 0.00 | 0.00 |
| Belmont | OVC | 0.10 | 0.10 | 72.73 | 72.73 | 0.04 | 0.04 |
| Northern Colorado | BSky | 0.10 | 0.10 | 61.29 | 61.29 | 0.02 | 0.02 |
| Oregon | P12 | 0.10 | 0.10 | 64.71 | 64.71 | 0.03 | 0.03 |
| VCU | A10 | 0.10 | 0.10 | 54.55 | 54.55 | 0.01 | 0.01 |
| Texas A&M | SEC | 0.10 | 0.10 | 62.50 | 62.50 | 0.02 | 0.02 |
| UCLA | P12 | 0.10 | 0.10 | 65.62 | 65.62 | 0.03 | 0.03 |
| Duquesne | A10 | 0.10 | 0.10 | 50.00 | 50.00 | 0.00 | 0.00 |
| Radford | BSth | 0.10 | 0.10 | 62.50 | 62.50 | 0.02 | 0.02 |
| Incarnate Word | Slnd | 0.10 | 0.10 | 12.50 | 12.50 | -0.07 | -0.07 |
| Niagara | MAAC | 0.09 | 0.09 | 59.38 | 59.38 | 0.02 | 0.02 |
| Florida | SEC | 0.09 | 0.09 | 62.50 | 62.50 | 0.02 | 0.02 |
| Alabama | SEC | 0.09 | 0.09 | 55.88 | 55.88 | 0.01 | 0.01 |
| Fairleigh Dickinson | NEC | 0.08 | 0.08 | 37.93 | 37.93 | -0.02 | -0.02 |
| Wagner | NEC | 0.08 | 0.08 | 70.00 | 70.00 | 0.03 | 0.03 |
| Bryant | NEC | 0.08 | 0.08 | 9.68 | 9.68 | -0.06 | -0.06 |
| Longwood | BSth | 0.08 | 0.08 | 13.33 | 13.33 | -0.06 | -0.06 |
| Cornell | Ivy | 0.08 | 0.08 | 40.74 | 40.74 | -0.01 | -0.01 |
| UTEP | CUSA | 0.07 | 0.07 | 33.33 | 33.33 | -0.02 | -0.02 |
| Saint Louis | A10 | 0.07 | 0.07 | 50.00 | 50.00 | 0.00 | 0.00 |
| Wofford | SC | 0.07 | 0.07 | 60.00 | 60.00 | 0.01 | 0.01 |
| Montana | BSky | 0.07 | 0.07 | 77.42 | 77.42 | 0.04 | 0.04 |
| Arizona | P12 | 0.07 | 0.07 | 79.41 | 79.41 | 0.04 | 0.04 |
| Charleston Southern | BSth | 0.07 | 0.07 | 42.86 | 42.86 | -0.01 | -0.01 |
| Liberty | BSth | 0.07 | 0.07 | 54.84 | 54.84 | 0.01 | 0.01 |
| Oklahoma St. | B12 | 0.07 | 0.07 | 57.58 | 57.58 | 0.01 | 0.01 |
| Oral Roberts | Sum | 0.07 | 0.07 | 28.57 | 28.57 | -0.03 | -0.03 |
| Rhode Island | A10 | 0.07 | 0.07 | 78.12 | 78.12 | 0.04 | 0.04 |
| Winthrop | BSth | 0.07 | 0.07 | 57.14 | 57.14 | 0.01 | 0.01 |
| Central Arkansas | Slnd | 0.07 | 0.07 | 50.00 | 50.00 | 0.00 | 0.00 |
| Kentucky | SEC | 0.07 | 0.07 | 70.59 | 70.59 | 0.03 | 0.03 |
| Auburn | SEC | 0.07 | 0.07 | 78.12 | 78.12 | 0.04 | 0.04 |
| Kansas St. | B12 | 0.07 | 0.07 | 66.67 | 66.67 | 0.02 | 0.02 |
| Vanderbilt | SEC | 0.07 | 0.07 | 37.50 | 37.50 | -0.02 | -0.02 |
| North Dakota | BSky | 0.07 | 0.07 | 33.33 | 33.33 | -0.02 | -0.02 |
| IUPUI | Horz | 0.07 | 0.07 | 32.14 | 32.14 | -0.02 | -0.02 |
| Illinois St. | MVC | 0.07 | 0.07 | 53.12 | 53.12 | 0.00 | 0.00 |
| Mississippi Valley St. | SWAC | 0.07 | 0.07 | 12.50 | 12.50 | -0.05 | -0.05 |
| Central Connecticut | NEC | 0.05 | 0.05 | 43.75 | 43.75 | -0.01 | -0.01 |
| LIU Brooklyn | NEC | 0.05 | 0.05 | 51.52 | 51.52 | 0.00 | 0.00 |
| Mount St. Mary's | NEC | 0.05 | 0.05 | 53.33 | 53.33 | 0.00 | 0.00 |
| Sacred Heart | NEC | 0.05 | 0.05 | 30.00 | 30.00 | -0.02 | -0.02 |
| St. Francis NY | NEC | 0.05 | 0.05 | 37.93 | 37.93 | -0.01 | -0.01 |
| DePaul | BE | 0.05 | 0.05 | 35.48 | 35.48 | -0.02 | -0.02 |
| Hartford | AE | 0.05 | 0.05 | 58.06 | 58.06 | 0.01 | 0.01 |
| North Carolina | ACC | 0.05 | 0.05 | 71.43 | 71.43 | 0.02 | 0.02 |
| Oklahoma | B12 | 0.05 | 0.05 | 58.06 | 58.06 | 0.01 | 0.01 |
| Sam Houston St. | Slnd | 0.05 | 0.05 | 51.72 | 51.72 | 0.00 | 0.00 |
| Valparaiso | MVC | 0.05 | 0.05 | 43.33 | 43.33 | -0.01 | -0.01 |
| Brown | Ivy | 0.05 | 0.05 | 38.46 | 38.46 | -0.01 | -0.01 |
| Columbia | Ivy | 0.05 | 0.05 | 26.92 | 26.92 | -0.02 | -0.02 |
| Dartmouth | Ivy | 0.05 | 0.05 | 23.08 | 23.08 | -0.03 | -0.03 |
| Little Rock | SB | 0.05 | 0.05 | 20.00 | 20.00 | -0.03 | -0.03 |
| McNeese St. | Slnd | 0.05 | 0.05 | 32.00 | 32.00 | -0.02 | -0.02 |
| Montana St. | BSky | 0.05 | 0.05 | 36.67 | 36.67 | -0.01 | -0.01 |
| Norfolk St. | MEAC | 0.05 | 0.05 | 43.33 | 43.33 | -0.01 | -0.01 |
| North Texas | CUSA | 0.05 | 0.05 | 43.33 | 43.33 | -0.01 | -0.01 |
| Yale | Ivy | 0.05 | 0.05 | 50.00 | 50.00 | 0.00 | 0.00 |
| Davidson | A10 | 0.05 | 0.05 | 65.62 | 65.62 | 0.02 | 0.02 |
| Fordham | A10 | 0.05 | 0.05 | 29.03 | 29.03 | -0.02 | -0.02 |
| George Washington | A10 | 0.05 | 0.05 | 45.45 | 45.45 | -0.00 | -0.00 |
| Denver | Sum | 0.05 | 0.05 | 46.43 | 46.43 | -0.00 | -0.00 |
| Campbell | BSth | 0.05 | 0.05 | 46.43 | 46.43 | -0.00 | -0.00 |
| Canisius | MAAC | 0.05 | 0.05 | 65.62 | 65.62 | 0.02 | 0.02 |
| Gardner Webb | BSth | 0.05 | 0.05 | 37.93 | 37.93 | -0.01 | -0.01 |
| High Point | BSth | 0.05 | 0.05 | 40.74 | 40.74 | -0.01 | -0.01 |
| Presbyterian | BSth | 0.05 | 0.05 | 27.59 | 27.59 | -0.02 | -0.02 |
| Texas St. | SB | 0.05 | 0.05 | 41.94 | 41.94 | -0.01 | -0.01 |
| Mississippi St. | SEC | 0.05 | 0.05 | 65.62 | 65.62 | 0.01 | 0.01 |
| USC Upstate | ASun | 0.05 | 0.05 | 10.71 | 10.71 | -0.04 | -0.04 |
| LSU | SEC | 0.05 | 0.05 | 54.84 | 54.84 | 0.00 | 0.00 |
| Missouri | SEC | 0.05 | 0.05 | 61.29 | 61.29 | 0.01 | 0.01 |
| South Carolina | SEC | 0.05 | 0.05 | 50.00 | 50.00 | 0.00 | 0.00 |
| Tennessee | SEC | 0.05 | 0.05 | 75.76 | 75.76 | 0.02 | 0.02 |
| Creighton | BE | 0.04 | 0.04 | 64.52 | 64.52 | 0.01 | 0.01 |
| Howard | MEAC | 0.04 | 0.04 | 25.81 | 25.81 | -0.02 | -0.02 |
| Ohio St. | B10 | 0.04 | 0.04 | 75.00 | 75.00 | 0.02 | 0.02 |
| Texas | B12 | 0.04 | 0.04 | 57.58 | 57.58 | 0.01 | 0.01 |
| Villanova | BE | 0.04 | 0.04 | 88.24 | 88.24 | 0.03 | 0.03 |
| American | Pat | 0.03 | 0.03 | 20.00 | 20.00 | -0.02 | -0.02 |
| Duke | ACC | 0.03 | 0.03 | 78.79 | 78.79 | 0.02 | 0.02 |
| Lehigh | Pat | 0.03 | 0.03 | 51.72 | 51.72 | 0.00 | 0.00 |
| Louisville | ACC | 0.03 | 0.03 | 60.61 | 60.61 | 0.01 | 0.01 |
| Stony Brook | AE | 0.03 | 0.03 | 38.71 | 38.71 | -0.01 | -0.01 |
| Bowling Green | MAC | 0.03 | 0.03 | 46.67 | 46.67 | -0.00 | -0.00 |
| Fresno St. | MWC | 0.03 | 0.03 | 63.33 | 63.33 | 0.01 | 0.01 |
| South Dakota | Sum | 0.03 | 0.03 | 73.33 | 73.33 | 0.01 | 0.01 |
| Southern Illinois | MVC | 0.03 | 0.03 | 59.38 | 59.38 | 0.00 | 0.00 |
| Boston University | Pat | 0.03 | 0.03 | 46.67 | 46.67 | -0.00 | -0.00 |
| Detroit | Horz | 0.03 | 0.03 | 20.00 | 20.00 | -0.02 | -0.02 |
| Grambling St. | SWAC | 0.03 | 0.03 | 53.33 | 53.33 | 0.00 | 0.00 |
| Holy Cross | Pat | 0.03 | 0.03 | 38.71 | 38.71 | -0.01 | -0.01 |
| Illinois | B10 | 0.03 | 0.03 | 41.94 | 41.94 | -0.00 | -0.00 |
| Kennesaw St. | ASun | 0.03 | 0.03 | 28.57 | 28.57 | -0.01 | -0.01 |
| Manhattan | MAAC | 0.03 | 0.03 | 45.16 | 45.16 | -0.00 | -0.00 |
| Miami FL | ACC | 0.03 | 0.03 | 70.97 | 70.97 | 0.01 | 0.01 |
| Minnesota | B10 | 0.03 | 0.03 | 46.88 | 46.88 | -0.00 | -0.00 |
| Nicholls St. | Slnd | 0.03 | 0.03 | 60.71 | 60.71 | 0.01 | 0.01 |
| Northeastern | CAA | 0.03 | 0.03 | 68.75 | 68.75 | 0.01 | 0.01 |
| Prairie View A&M | SWAC | 0.03 | 0.03 | 45.45 | 45.45 | -0.00 | -0.00 |
| Vermont | AE | 0.03 | 0.03 | 78.79 | 78.79 | 0.01 | 0.01 |
| Akron | MAC | 0.02 | 0.02 | 41.94 | 41.94 | -0.00 | -0.00 |
| Austin Peay | OVC | 0.02 | 0.02 | 53.33 | 53.33 | 0.00 | 0.00 |
| Ball St. | MAC | 0.02 | 0.02 | 58.06 | 58.06 | 0.00 | 0.00 |
| Bethune Cookman | MEAC | 0.02 | 0.02 | 53.33 | 53.33 | 0.00 | 0.00 |
| Clemson | ACC | 0.02 | 0.02 | 71.88 | 71.88 | 0.01 | 0.01 |
| Furman | SC | 0.02 | 0.02 | 67.74 | 67.74 | 0.01 | 0.01 |
| George Mason | A10 | 0.02 | 0.02 | 48.48 | 48.48 | -0.00 | -0.00 |
| Georgia St. | SB | 0.02 | 0.02 | 68.75 | 68.75 | 0.01 | 0.01 |
| Hofstra | CAA | 0.02 | 0.02 | 60.00 | 60.00 | 0.00 | 0.00 |
| La Salle | A10 | 0.02 | 0.02 | 40.62 | 40.62 | -0.00 | -0.00 |
| Monmouth | MAAC | 0.02 | 0.02 | 35.48 | 35.48 | -0.01 | -0.01 |
| Ohio | MAC | 0.02 | 0.02 | 43.33 | 43.33 | -0.00 | -0.00 |
| Old Dominion | CUSA | 0.02 | 0.02 | 78.12 | 78.12 | 0.01 | 0.01 |
| Richmond | A10 | 0.02 | 0.02 | 37.50 | 37.50 | -0.01 | -0.01 |
| St. Bonaventure | A10 | 0.02 | 0.02 | 78.12 | 78.12 | 0.01 | 0.01 |
| Tennessee Tech | OVC | 0.02 | 0.02 | 54.84 | 54.84 | 0.00 | 0.00 |
| UNC Greensboro | SC | 0.02 | 0.02 | 77.42 | 77.42 | 0.01 | 0.01 |
| Western Carolina | SC | 0.02 | 0.02 | 36.67 | 36.67 | -0.01 | -0.01 |
| Wichita St. | Amer | 0.02 | 0.02 | 78.12 | 78.12 | 0.01 | 0.01 |
| Arkansas | SEC | 0.02 | 0.02 | 67.65 | 67.65 | 0.01 | 0.01 |
| Georgia Tech | ACC | 0.02 | 0.02 | 40.62 | 40.62 | -0.00 | -0.00 |
| Marquette | BE | 0.02 | 0.02 | 59.38 | 59.38 | 0.00 | 0.00 |
| Mississippi | SEC | 0.02 | 0.02 | 37.50 | 37.50 | -0.01 | -0.01 |
| Rider | MAAC | 0.02 | 0.02 | 70.97 | 70.97 | 0.01 | 0.01 |
| South Dakota St. | Sum | 0.02 | 0.02 | 80.00 | 80.00 | 0.01 | 0.01 |
| Temple | Amer | 0.02 | 0.02 | 53.12 | 53.12 | 0.00 | 0.00 |
| Texas A&M Corpus Chris | Slnd | 0.02 | 0.02 | 30.77 | 30.77 | -0.01 | -0.01 |